![]()
The Month That Was-October 2017
MARKET SUMMARY: Steady as She Goes
After another month of gains we look no further than yesterday’s Fed statement for clues as to what’s keeping things moving steadily higher. In their statement, they changed the economic outlook from “moderate” to “solid” (a word we have been prone to use in our reports). This week we received a report on productivity, which was (you guessed it) solid. Before going to commercial on CNBC a song was playing with the lyrics “Steady as She Goes”. We can’t think of a more apt description of current movements both economically and in markets.
Domestically, almost all of the major economic data points released during the month met or exceeded expectations. These data points continued to post numbers with absolute levels as high as we have seen in many, many years. Further, and potentially more importantly, the totality of the earnings reports from October confirmed an earnings growth environment. And beyond this, globally, European and emerging markets continued to show growth both in their economies and their markets. In fact, it appears that for the first time since 2009, the all worlds index should outperform the S&P 500 in 2017.
CLOSED-END FUND (CEF) COMMENTARY: Are Discounts Topping Out?
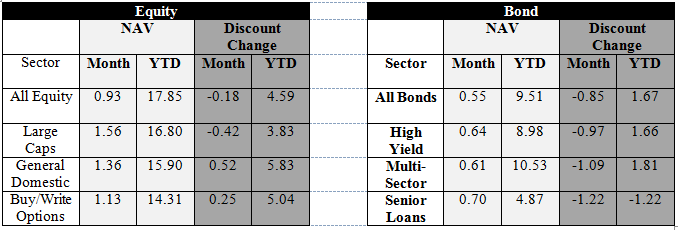
After a somewhat steady narrowing in overall discount levels throughout 2017, discounts hit the pause button in October. As shown in the table above, both equity and bond funds widened out a bit. In this vein, we have begun to hear many CEF pundits ask the question of whether this
decline suggests a topping out of CEF discount levels. We will address that question below.
As we have stated in the past, most answers to financial/economical questions, begin with “It depends.” And this query is no exception to that general rule. In fact, as we will explain our thoughts through the use of charts, another “it depends” presents itself. Here at SFS, we have a running joke about trying to analyze any relative level through the use of a chart(s). When asked if any level looks particularly high or low based upon a viewing of a chart, the response is almost always: “It depends, should I cover up the left side of the chart?”
In order to discuss the relative level of CEFs as they sit today, we will look at a six (6) year chart of discount levels. We believe that this is an appropriate time frame as it filters out the wild ride of the 2008 Great Recession, but does include the Taper Tantrum of 2013. As we are still in the midst of the period of “normalization” of interest rates which lies at the heart of the Taper Tantrum, we believe that any analysis of discounts absent this period is flawed.
So now the question: Should I cover up the left side of the chart? To begin with, we will do just that.
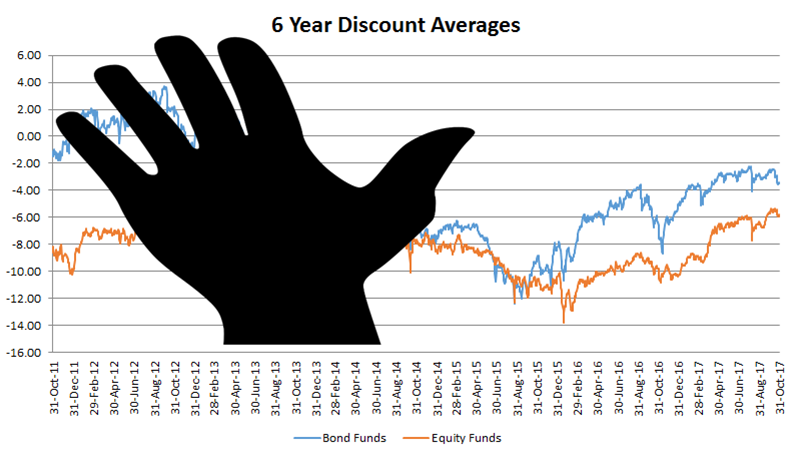
With the left side covered, what we see is a rather steady narrowing in discount levels over the past two years. We see that discounts have actually moved up around six (6) full discount points during this period. When viewed in this manner, one might easily come to the conclusion that CEF discounts have risen to a point in which one would expect a bit of general widening to occur.
But what if we remove our hand from the graph and actually look at the entirety of the graph?
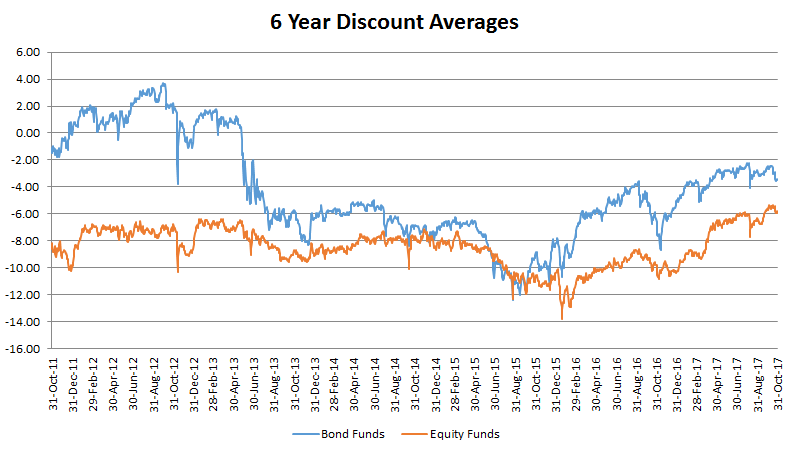
When we do this, we are reminded of just how much of a decline CEF discounts experienced in the Taper Tantrum relative to the smaller widening at the end of 2015. When analyzed under this longer term view, discounts don’t appear to be particularly high. With regard to equity funds, current levels seem basically in line with expected levels (when looked at through this prism). As for bond funds, a rather strong argument could be made for an expectation of continued narrowing.
Here at SFS, we take a reactive as opposed to pro-active approach to trading CEFs through our Discount Capture strategy. Accordingly, it is not necessary or even appropriate for us to take an early position as to which way discounts will move in the future, but instead focus upon the day-to-day directionality and inefficiencies. That being said, we do favor the longer-term (no hand) view of discounts and believe that they have not “topped out” quite yet.
As a final note, we do continue to believe in our annual widening/narrowing cycle which occurs at year-end due to tax loss selling. On this front, we are expecting to see some widening between mid-November through the end of December. This widening should be met with a corresponding narrowing in early January (the “January Effect”). Accordingly, we will continue to implement our strategies with this in mind